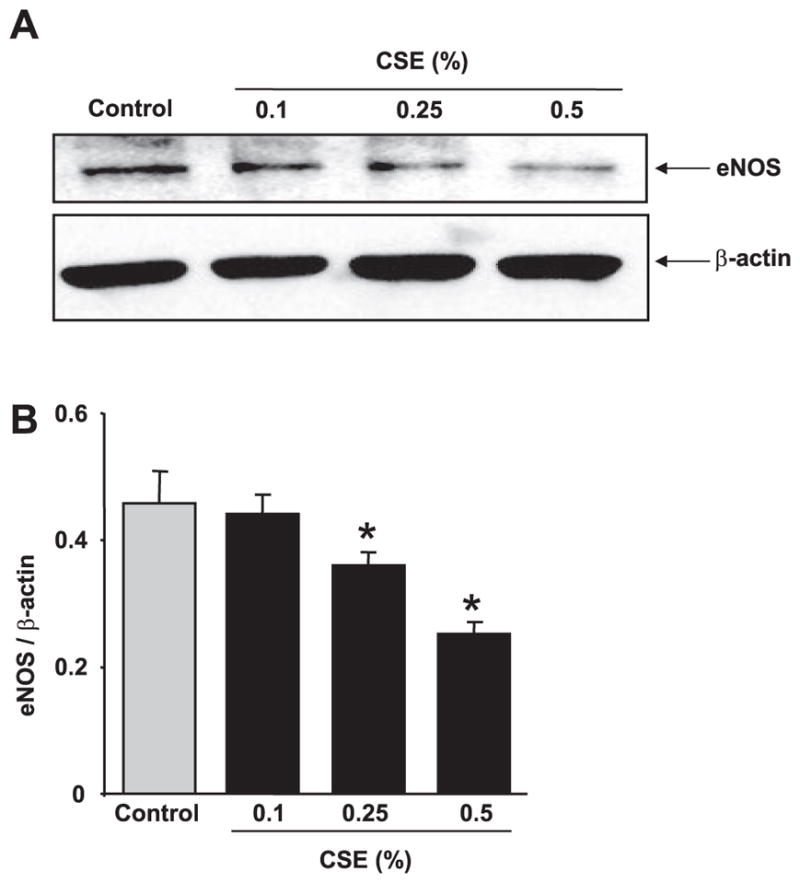
Figure 8.

CSE concentration dependently down-regulated the level of eNOS in HMVEC-Ls. A) HMVEC-Ls were treated with CSE (0.1–0.5%) for 12 h in 0.1% FBS containing EGM-2 media, and eNOS protein levels were measured using immunoblotting. eNOS protein levels were down-regulated in a concentration-dependent manner (0.25 and 0.5%. B) Histograms represent mean ± SE relative expression levels of VEGFR-2 and eNOS (n=3). *P < 0.05 vs. control groups.
