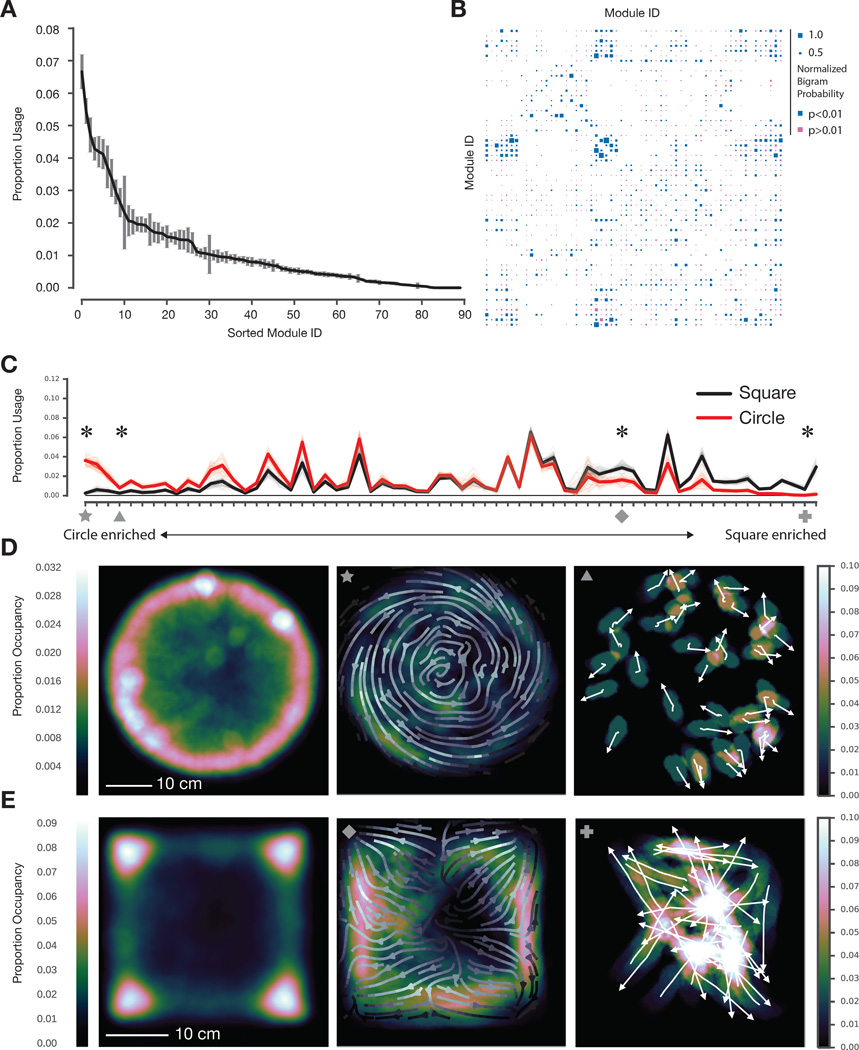
Fig. 3. The physical environment influences module usage and spatial pattern of expression.
A. Modules identified by the AR-HMM, sorted by usage (n = 25 mice, 20 minutes per mouse, data from circular open field, error bars are SEs calculated using bootstrap estimation, n=100 bootstrap estimates, see Fig. S5E for Bayesian credible intervals). B. Hinton diagram depicting the probability that any pair of modules is observed as an ordered pair (p-values calculated via bootstrap estimation and color coded); modules were sorted by spectral clustering to emphasize neighborhood structure. C. Module usage, sorted by context (with “circleness” on left, overall usages differ significantly, p < 10−15, Hotelling two-sample t-squared test, see Supplemental Experimental Procedures for sorting details). Mean usages across animals depicted with dark lines, with bootstrap estimates depicted in fainter lines (n=100). Marked modules discussed in main text and shown in panel D: star = circular wall-hugging locomotion (“thigmotaxis”), triangle = outward-facing rears, diamond = square thigmotaxis, cross = square dart, see Movie S7. Usage for all marked modules significantly modulated by context (indicated by asterisk, Wald Test, Holm-Bonferroni adjusted p < 0.006 for square dart, otherwise p < 10−5). D. Occupancy plot of mice in circular open field (left, n=25, 500 minutes total) indicating cumulative spatial positions across all experiments. Occupancy plot depicting deployment of circular thigmotaxis module (middle, average orientation across the experiment indicated as arrow field) and circle-enriched outward-facing rear module (right, orientation of individual animals indicated with arrows). E. Occupancy plot of mice in square box (left, n=15, 300 minutes total) indicating cumulative spatial positions across all experiments. Occupancy plot depicting a square-enriched thigmotaxis module (middle, average orientation across the experiment indicated as arrow field), and square-specific darting module (right, orientation of individual animals indicated with arrows).

