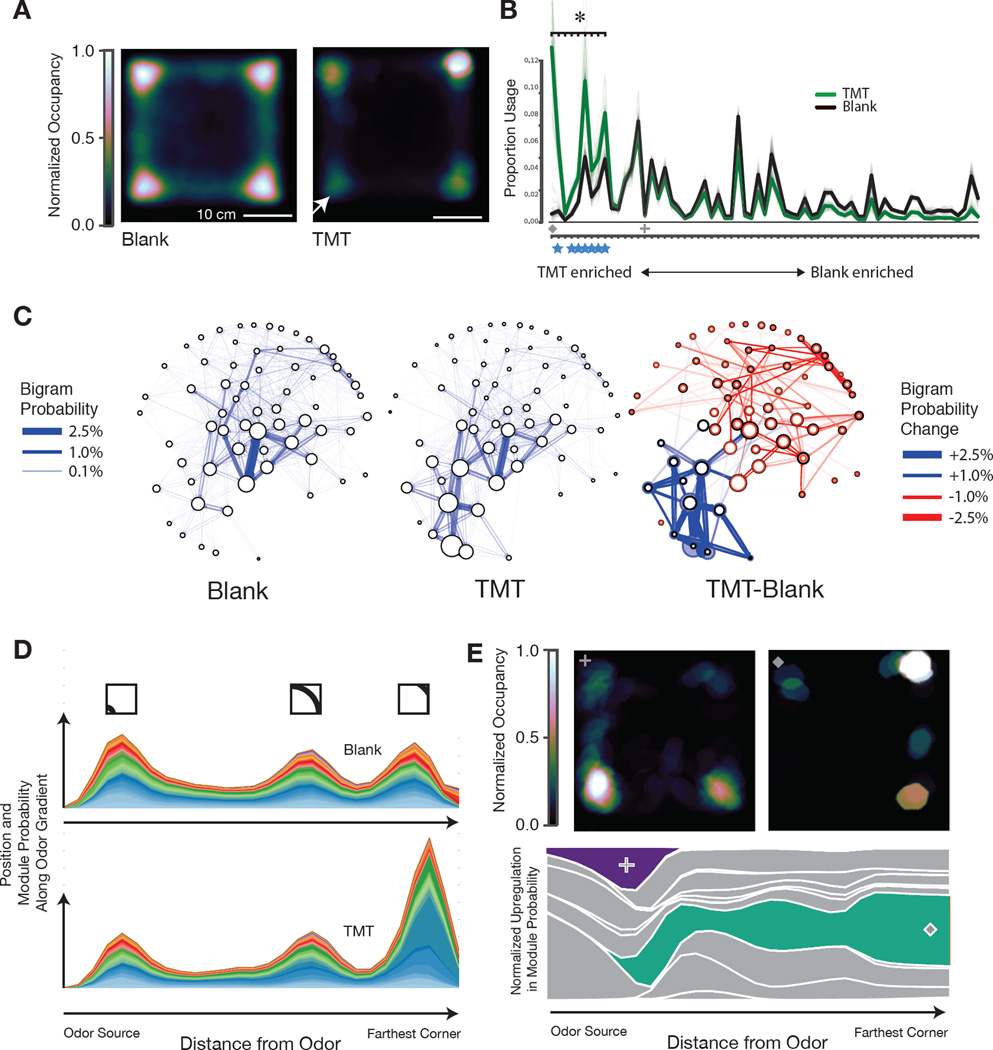
Fig. 4. Odor-driven innate avoidance alters transition probabilities.
A. Occupancy plot of mice under control conditions (n=24, 480 minutes total) and after exposure to the fox-derived odorant trimethylthiazoline (TMT, 5% dilution, n=15, 300 minutes total, model co-trained on both conditions) in the lower left quadrant (arrow). Plots normalized such that maximum occupancy = 1. B. Module usage plot sorted by “TMT-ness” (Dark lines depict mean usages, bootstrap estimates depicted in fainter lines, sorting as in Fig. 3). Marked modules discussed in main text and panel E: cross = sniff in TMT quadrant, diamond = freeze away from TMT, see Movies S8 and S9. Blue stars indicate freezing modules. Asterisk indicates statistically-significant regulation (Wald test, Holm-Bonferroni corrected, p < 10−4). C, left and middle. Behavioral state maps for mice exploring a square box before and after TMT exposure, with modules depicted as nodes (usage proportional to the diameter of each node), and bigram transition probabilities depicted as directional edges. Graph layout minimizes the length of edges and is seeded by spectral clustering to emphasize local structure. C, right. Statemap depiction of the difference between blank and TMT. Usage differences are indicated by the newly-sized colored circles (upregulation indicated in blue, downregulation indicated in red, previous usages in control conditions indicated in black). Altered bigram transition probabilities are indicated in the same color code; only those significant transition probabilities (p<0.01) are depicted. D. Mountain plot depicting the joint probability of module expression and spatial position, plotted with respect to the TMT corner (X-axis); note that the “bump” two-thirds of the way across the graph occurs due to the two corners equidistant from the odor source (see inset for approximate position in square box, modules are color coded). E. Occupancy plot (upper) indicating spatial position at which mice after TMT exposure emit an investigatory sniffing module (left) or a pausing module (right, see Movie S8). Mountain plot (lower) indicating the differential deployment of these two modules (purple, green; other modules in grey) with respect to distance from the odor source.

