
Figure 1.
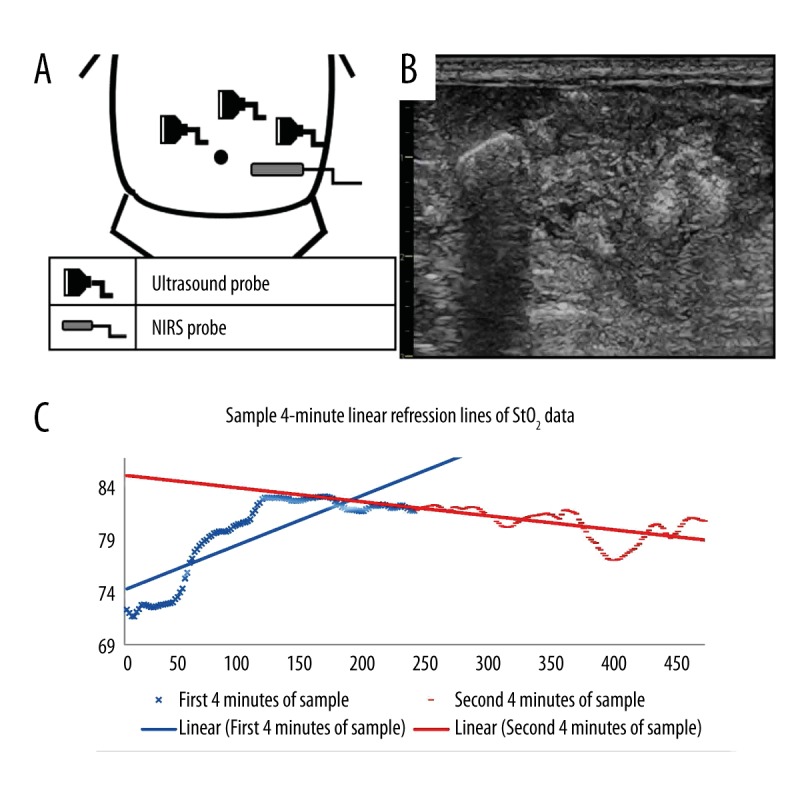
(A) Diagram that summarizes the approximate position of ultrasound transducer and NIRS probe. (B) Sample image of an abdominal ultrasound scan of the right side of the abdomen. Multiple short echogenic lines representing bowel lines can be seen. (C) StO2 vs. Time plot of an 8-min sample of tissue oximetry. The solid blue line is the line of best fit for the first 4 minutes of the 8-min sample. The solid red line is the line of best fit of the second 4 minutes of an 8-min sample.