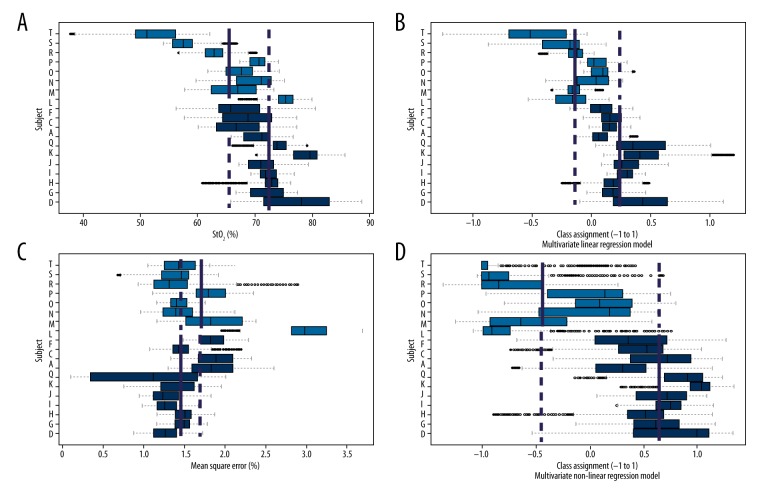
Figure 3.
Relationship between StO2 measurements and US categories. Four sets of 19 horizontal box plots. Each box plot summarizes the mean and interquartile ranges for each StO2 parameter, obtained from the 4-min linear fits over a 24-h period. Green box plots correspond to neonates with normal/hyperactive motility. Yellow box plots correspond to neonates with no/low motility. Solid blue vertical lines represent the mean of each category. Dashed blue vertical lines were added as continuations of the solid lines for comparison. (A) Neonates assigned to normal/hyperactive group had higher average StO2 than those assigned to no/low motility (72.25±4.36 vs. 65.53±7.93; p<0.05, F value=5.65). (B) The variability (average of residual error of 4 min linear fits) was not significantly different between the 2 categories (1.48±0.26 vs. 1.73±0.58, p=0.213, F=0.213). (C) The multivariate linear regression model utilizing a combination of means, residuals, and pairwise products of both described higher separation (0.47±0.26 vs. −0.24±0.33, p<0.01, F=27.4). (D) The highest separation was found utilizing a multivariate nonlinear regression model (0.47±0.26 vs. −0.24±0.33 vs., p<0.01, F=27.4).

