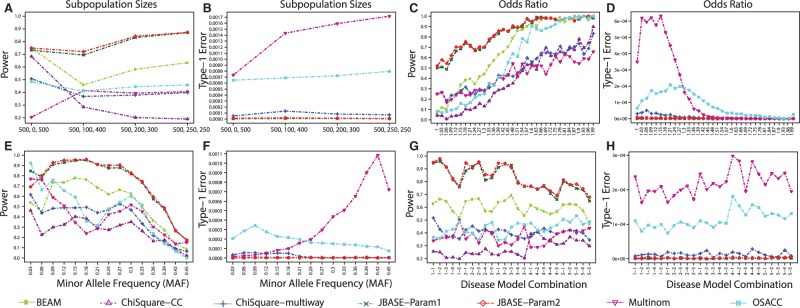
Fig. 2.
Disease model results: performance of all algorithms across four dimensions: subpopulation size (A, B), odds ratios (C, D), MAF (E, F) and disease model combinations (G, H). For each plot, the performance is averaged over dimensions other than the dimension in focus. For example, for (A) all MAF, odds ratios and disease model combinations are averaged over and broken into subpopulation size combinations (see also Supplementary Figs. S6 and S7 for additional results under various call confidence thresholds)

