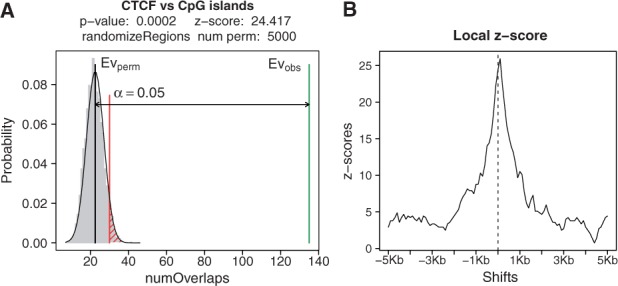
Fig. 1.

(A) Plot of the results of a permutation test assessing the association between a subset of 1000 HepG2 CTCF narrow peaks (ENCODE/Broad Institute) and CpG islands (Wu et al., 2010), using a per chromosome randomization of CTCF peaks, the number of overlaps as the evaluation function and 5000 permutations. The association is highly significant with the observed value far from the limit of significance of the random distribution. (B) Plot of the local z-score of the permutation test in A. The association is strongly related to the exact position of the CTCF peaks since the z-score drops sharply as soon as the regions are shifted a few hundreds of bases
