
Fig. 2.
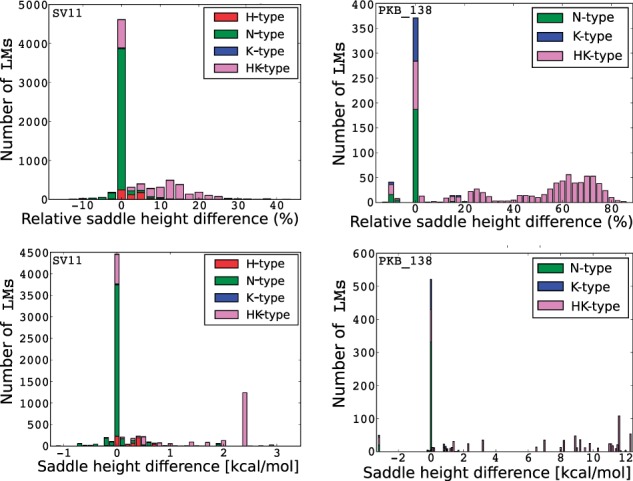
Histograms of saddle height changes between BHG and BHG for a substrate for SV11 (left) and the tRNA-like pseudoknot of barley stripe mosaic virus PKB_138 (right). (Top left/right) The x-axes denote the relative changes (%) between saddle heights of LMs pairs in BHG and BHG and y-axes are the corresponding numbers of pseudoknot-free LMs pairs with such saddle changes. (Bottom left/right) The x-axes denote the exact changes (kcal/mol). Colors indicate the pseudoknot types appearing in the energetically optimal paths between LM pairs. Green (N-type) indicates the simulated paths do not contain any pseudoknotted structures. Pink (HK-type) indicates the simulated paths contain pseudoknotted structures of both H-type and K-type. More examples can be found in SM Part F (Color version of this figure is available at Bioinformatics online.)