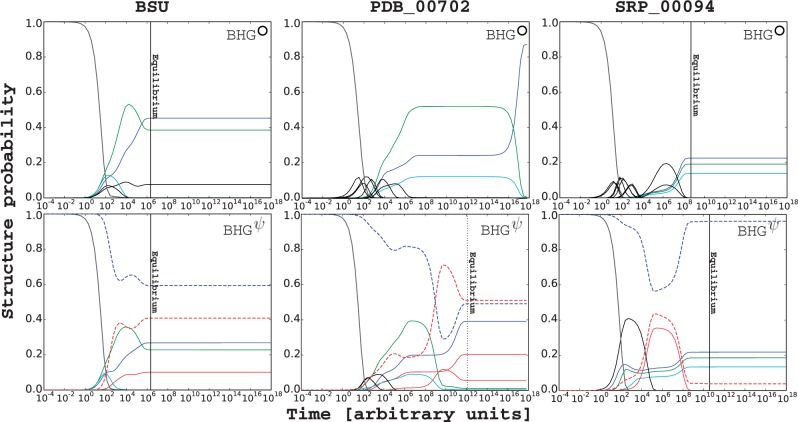
Fig. 3.
Folding kinetics comparison between BHG (top) and BHG (bottom) of the preQ1 riboswitch (Bsu, left), the Ribosomal RNA from E.coli (PDB_00702, middle), and the signal recognition particle RNA (SRP_00094, right). The process was started in the open chain structure and run until convergence to the thermodynamic equilibrium distribution except the case of PDB_00702 on BHG where the equilibrium was still not reached until 1018 arbitrary time units. Dotted vertical line indicates when the simulation reaches its equilibrium. The LMs that appear in both kinetics plots are marked with same color, otherwise pseudoknot-free and pseudoknotted LMs are marked with black and red, respectively. The sums of the structure probabilities of pseudoknot-free and pseudoknotted LMs on BHG are marked with blue and red dashed lines, respectively (Color version of this figure is available at Bioinformatics online.)

