
Fig. 5.
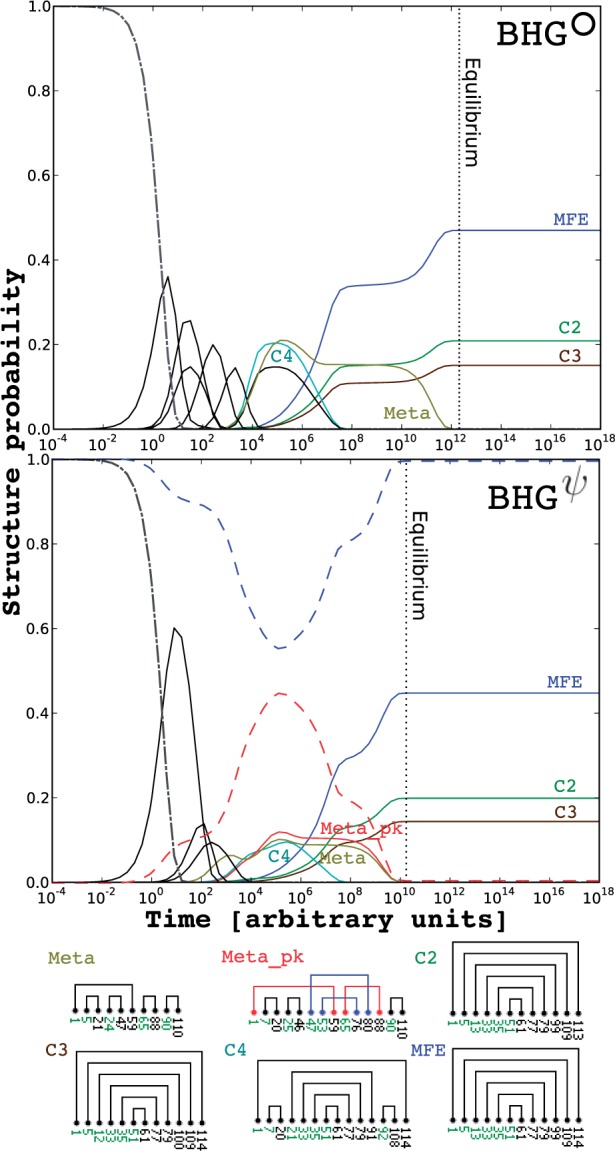
Folding kinetics of SV11 RNA switch L07337_1 based on BHG (top) and BHG (bottom). Both simulations were started in the open chain structure and run until convergence to the thermodynamic equilibrium distribution. Only LMs whose population probabilities reach 14.5% (BHG) and 9% (BHG) are visualized for the sake of clarity. The state space of this simulation is reduced to 104 LMs from 175 733 LMs on BHG (BHG contains 8105 LMs, so no further reduction is applied). The x- and y-axes indicate the time and population probabilities, respectively. Dotted vertical line indicates when the simulation reaches its equilibrium. The LMs that appear in both kinetics plots are marked with same color, otherwise black. The only exceptional case is the Meta_pk, which is marked red for highlighting purposes. The sums of the population probabilities of pseudoknot-free and pseudoknotted LMs on BHG are marked with blue and red broken lines, respectively (Color version of this figure is available at Bioinformatics online.)