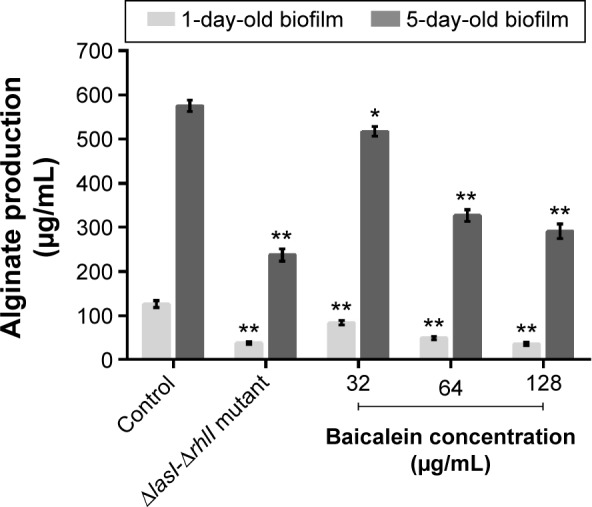
Figure 6.

Biofilm quantification by crystal violet assay.
Notes: The data represent the average values of three independent experiments. Values are mean ± standard error. *P<0.05 and **P<0.01 compared with the drug-free control group.

Biofilm quantification by crystal violet assay.
Notes: The data represent the average values of three independent experiments. Values are mean ± standard error. *P<0.05 and **P<0.01 compared with the drug-free control group.