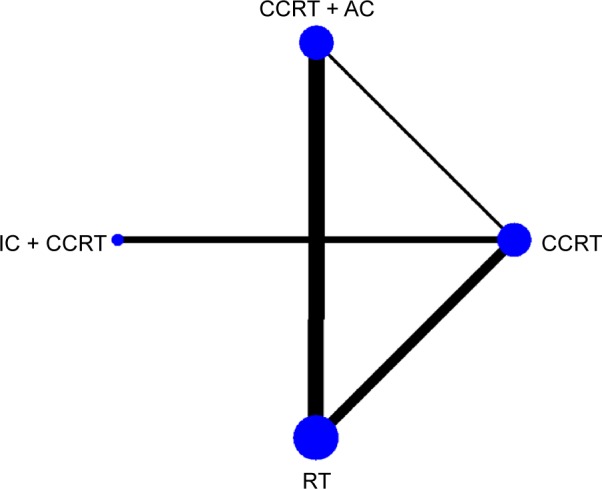
Figure 2.

Network plot for multiple-treatment comparison.
Notes: The widths of the lines are proportional to the numbers of trials comparing each pair of treatments. The size of each node is proportional to the number of assigned patients (sample size).
Abbreviations: AC, adjuvant chemotherapy; CCRT, concurrent chemoradiotherapy; IC, induction chemotherapy; RT, radiotherapy.
