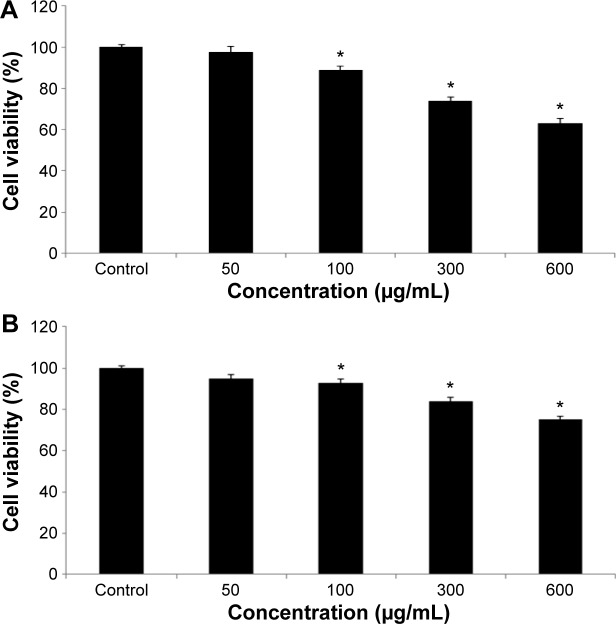
Figure 4.
Toxic effect of quercetol in HepG2 cells as determined by (A) MTT and (B) NRU tests.
Notes: Data are expressed as percentage viability of cells exposed to quercetol relative to control cells and mean ± SE of three experiments. *P<0.05 vs control, using one-way ANOVA.
Abbreviations: ANOVA, analysis of variance; MTT, 3-(4,5-dimethylthiazol-2-yl)-2,5-diphenyltetrazolium bromide; NRU, neutral red uptake; SE, standard error.

