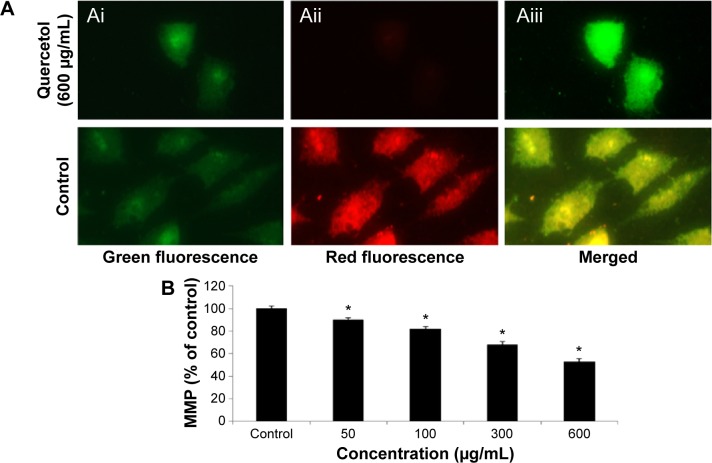
Figure 5.
Impact of quercetol on the MMP of HepG2 cells.
Notes: Panel (Ai) shows green fluorescence (JC-1 monomer) only, panel (Aii) shows red fluorescence (JC-1 aggregate) only, and the panel (Aiii) shows merged (green–red fluorescence). (B) % MMP ratio. Data are expressed as the mean ± SE of three experiments. *P<0.05 vs control, using one-way ANOVA.
Abbreviations: ANOVA, analysis of variance; MPP, mitochondrial membrane potential; SE, standard error.

