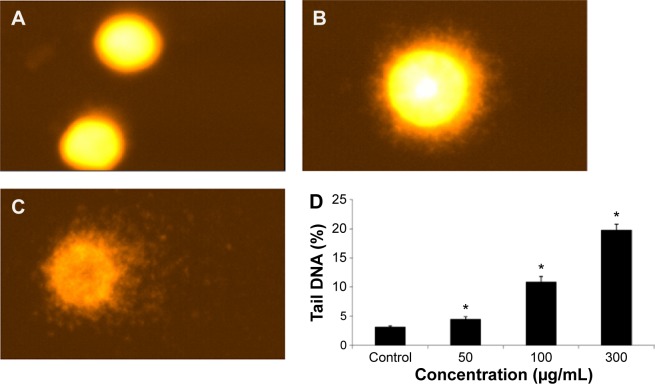
Figure 7.
Fragmentation of DNA in HepG2 cells due to 24 hour quercetol exposure.
Notes: (A) Untreated cell, (B) at 100 μg/mL of quercetol, (C) at 300 μg/mL of quercetol, (D) percentage tail DNA. Each value represents the mean ± SE of triplicate tests. *P<0.05 vs control, using one-way ANOVA.
Abbreviations: ANOVA, analysis of variance; SE, standard error.

