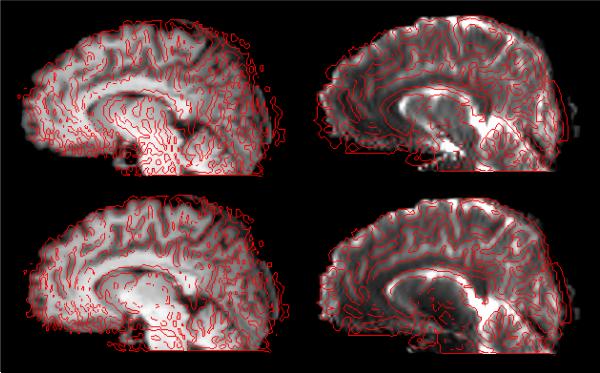
Fig. 3.
Overlay of a saggital slice before and after correction of the distortion in simulated EPI sequence (similar to fig. 4). First row shows image before distortion correction, while images after correction are presented in second row. First column shows the MPRAGE overlaid by the edge-map (in red) generated from b=0 image. Second column is converse to the first column (edge-map of MPRAGE superimposed on b=0 image).

