Figure 1.

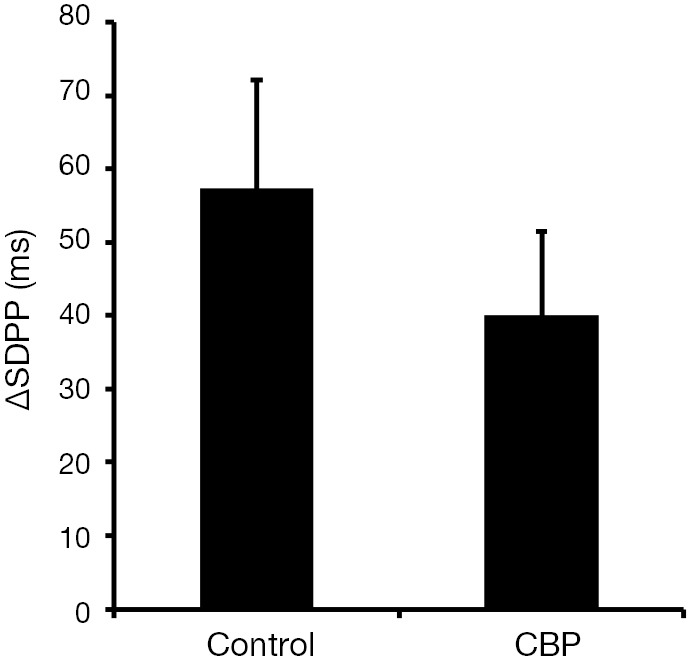
Graph bar showing the mean values of the variation of the standard deviation of the P wave interval of healthy subjects (control) and patients with chronic bladder pain (CBP). Adapted from Charrua et al. [2015] (5).

Graph bar showing the mean values of the variation of the standard deviation of the P wave interval of healthy subjects (control) and patients with chronic bladder pain (CBP). Adapted from Charrua et al. [2015] (5).