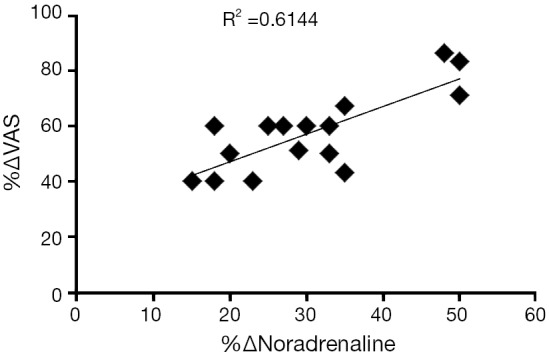
Figure 2.

Graph showing a significant correlation between the percentage of decrease of pain intensity (%∆VAS; if more than two) and the percentage of decrease of urinary noradrenaline (%∆Noradrenaline), at 1-month follow-up (n=16).

Graph showing a significant correlation between the percentage of decrease of pain intensity (%∆VAS; if more than two) and the percentage of decrease of urinary noradrenaline (%∆Noradrenaline), at 1-month follow-up (n=16).