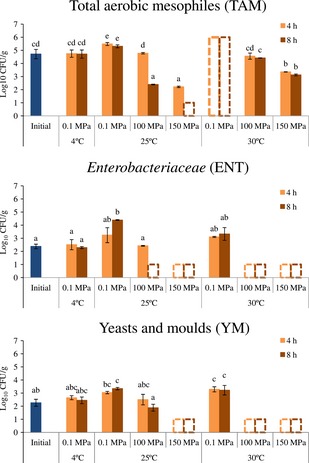
Figure 1.

Microbial counts (Log10 CFU/g) of TAM, ENT and YM in initial and after hyperbaric storage of soup for various combinations of time, pressure, and temperature: 4 and 8 h, 100 and 150 MPa and 25°C and 30°C; soup was also stored at control conditions for each temperature (25°C and 30°C, at 0.1 MPa) and at refrigeration conditions (4°C, 0.1 MPa). Different letters indicate significant differences (P < 0.05) between conditions. Values shown as 6 and 1 log units (bars with discontinuous borders), mean values above (higher than 6 log units), and below (lower than 1 log units) the quantification limits, respectively.
