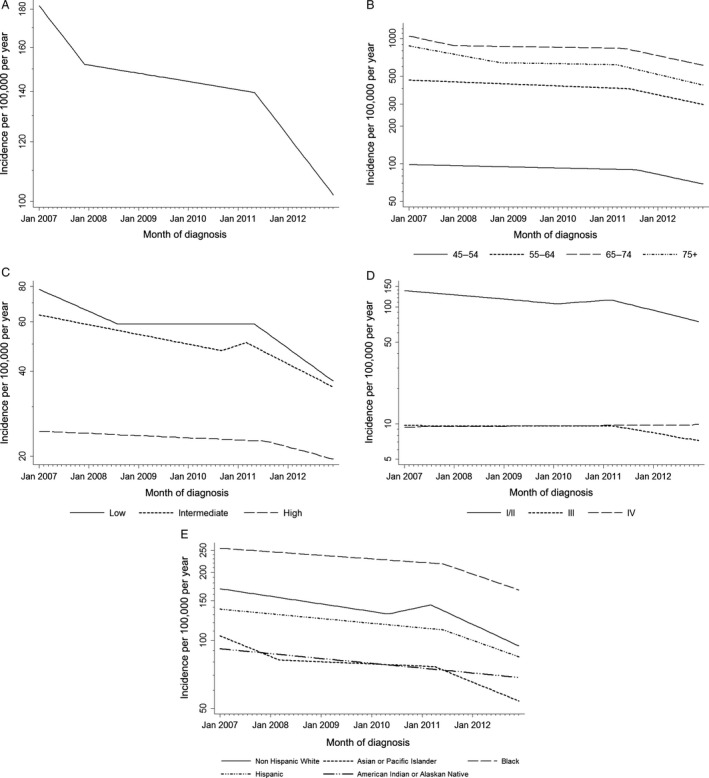
Figure 1.

Recent trends in prostate cancer incidence in Surveillance, Epidemiology, and End Results 18, JoinPoint regression by month of diagnosis. (A) Prostate cancer incidence, age‐adjusted. (B) Incidence by age at diagnosis. (C) Incidence of low‐ (Gleason score ≤6), intermediate‐ (Gleason score 7) and high‐grade (Gleason score 8–10) prostate tumors, age‐adjusted. (D) Incidence by stage at diagnosis age‐adjusted. (E) Incidence by race and ethnicity, age‐adjusted. Inflection points represent time points of significant change in trend.
