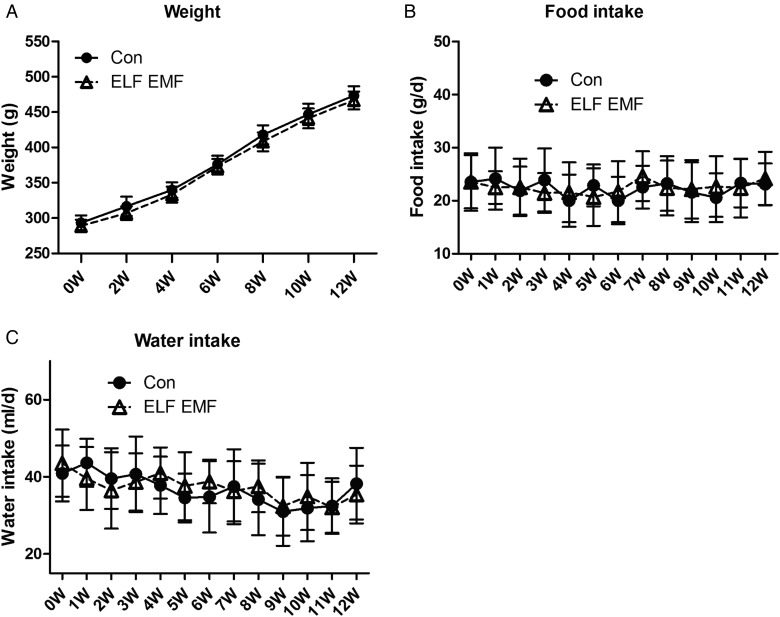
Fig. 2.
General conditions of the rats during the 12-week exposure. (A) The weight of the rats in the control group and the ELF EMF–exposed group. (B) The food intake of the rats in the control group and the ELF EMF–exposed group. (C) The water intake of the rats in the control group and the ELF EMF–exposed group. Error bars indicate the standard deviation (SD) of the mean for n = 64 independent experiments.

