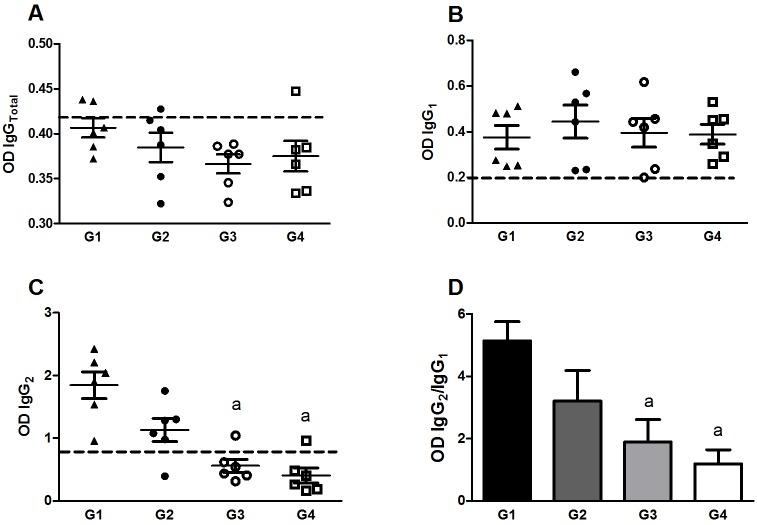
Fig 5. Specific antibody production 1 month after challenge.
ELISAs using plates coated with SLA from L. donovani were performed to detect production of total IgG (A), IgG1 (B), IgG2 (C) and the ratio IgG2/IgG1 (D). The antibody OD values are shown on the y-axis, and the error bars indicate the standard deviation. Dotted lines represent the cut-off value. Statistical differences (p<0.05) are indicated in letters (a: G1).

