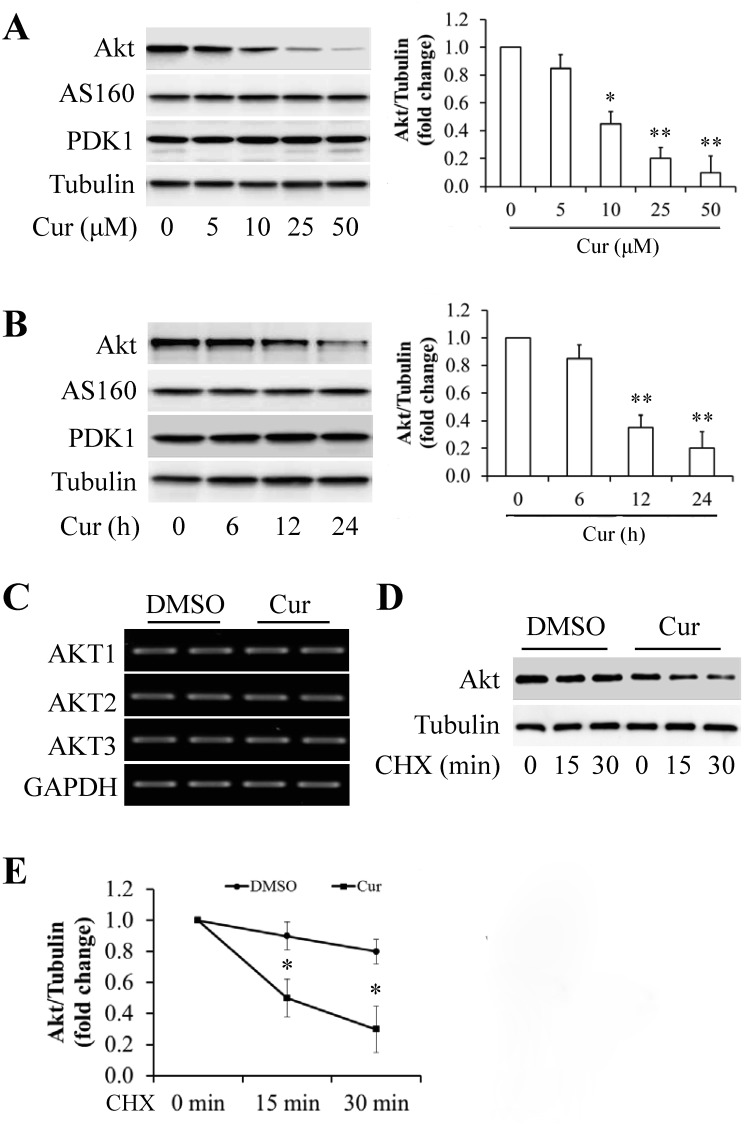
Fig 2. Effect of curcumin on Akt expression in MDA-MB-231 cells.
(A and B) Dose- and time-responses of curcumin (Cur) on Akt protein levels. Left panels are representative western blot bands of Akt. Right panels are quantitative analysis of Akt levels. (C) Stable mRNA expression of three AKT isoforms in curcumin-treated cells. (D) Cycloheximide (CHX) chase assay. (E) Akt protein level in (D) was analyzed quantitatively in a line graph. Data are means ± SEM. (n = 3).* p<0.05, ** p<0.01 vs DMSO control.

