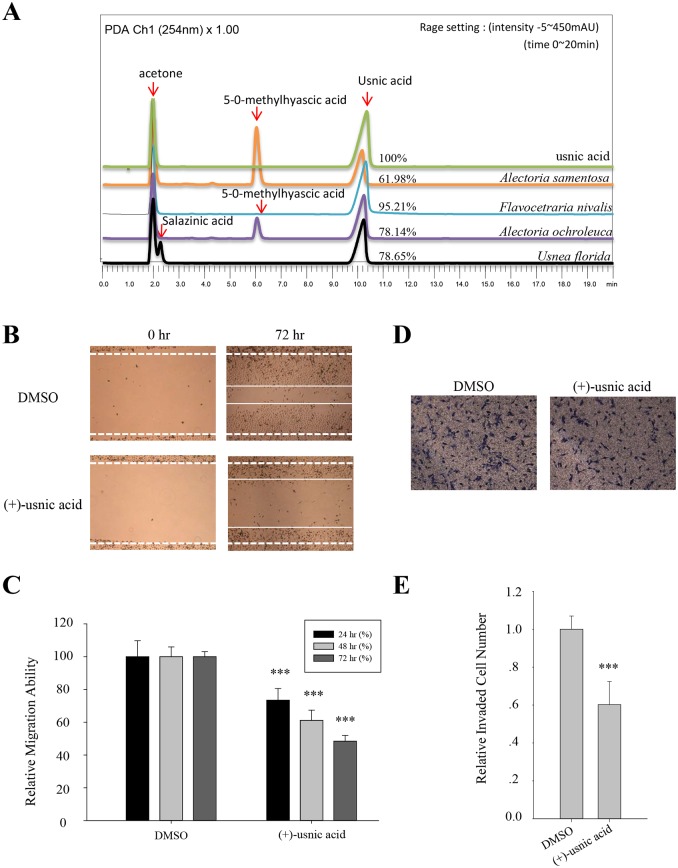
Fig 2. Identification of lichen secondary metabolite from candidate lichens.
(A) High performance liquid chromatography (HPLC) analysis of lichen acetone extracts. The %intensity of peak for the usnic acid in the extract at a concentration of 5 mg/ml was obtained by comparing to that of peak for pure 5 mg/ml usnic acid. (B–C) Migration assay of A549 cells treated with 5 μM of (+)-usnic acid (B), and quantitative analysis of wound length (C). (D–E) Invasion assay of A549 cells treated with 5 μM of (+)-usnic acid (D), and quantitative analysis of invaded cell numbers in each group (E). Representative images are shown from three independent experiments, n = 3. Data represent mean ± S.E.M. (standard error of the mean). ***p<0.001; NS, no significant difference compared to 0.01% DMSO-treated A549 cells.

