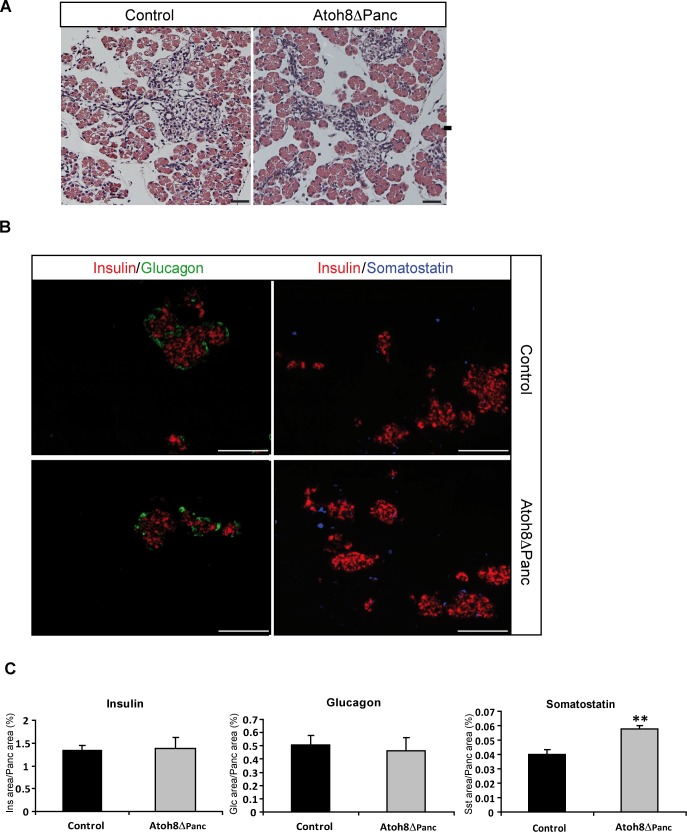
Fig 2. Pancreatic phenotype of Atoh8 Δpanc mice at postnatal day 1.
(A) Hematoxilin-eosin staining of pancreatic sections revealed similar organ structure in P1 Atoh8 Δpanc and control littermates. Bars represent 50 μM (B) Representative immunofluorescence staining for the major islets cell types (insulin in red, glucagon in green and somatostatin in blue) on pancreas tissue sections from P1 Atoh8 Δpanc and control littermates. Bars represent 100 μM (C) Morphometric quantification of hormone immunoreactive areas relative to total pancreatic area. n = 3; mean ± SE; **p < 0.01 vs Control.

