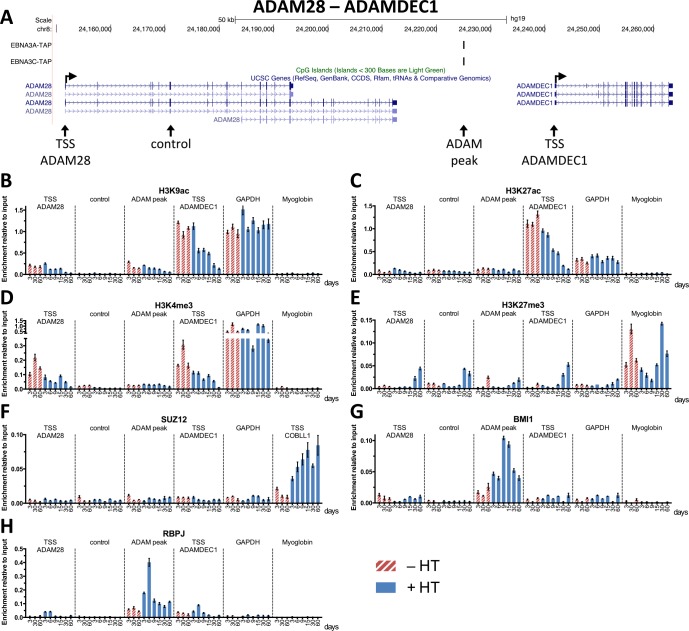
Fig 4. Epigenetic changes and factor accumulation at sites within the ADAM28-ADAMDEC1 locus during the 3CHT A13 time-course.
(A) UCSC genome browser overview of ADAM28-ADAMDEC1 genomic locus showing ChIP-seq tracks for EBNA3A-TAP, EBNA3C-TAP, the TSSs (horizontal arrows) and CpG islands. Primer locations for ChIP-qPCR (TSS ADAM28, control, ADAM peak and TSS ADAMDEC1) are indicated (vertical arrows below UCSC genes track). (B-H) ChIP for H3K9ac (B), H3K27ac (C), H3K4me3 (D), H3K27me3 (E), SUZ12 (F), BMI1 (G) and RBPJ (H) on samples from 3CHT A13 time-course at locations across the ADAM28-ADAMDEC1 locus, at GAPDH or myoglobin as indicated. Cells were grown in the absence (-HT) or presence of HT (+HT) and numbers indicate the day of harvest. ChIP values represent enrichment relative to input ± standard deviations of triplicate qPCR reactions for ChIP and input of each sample.

