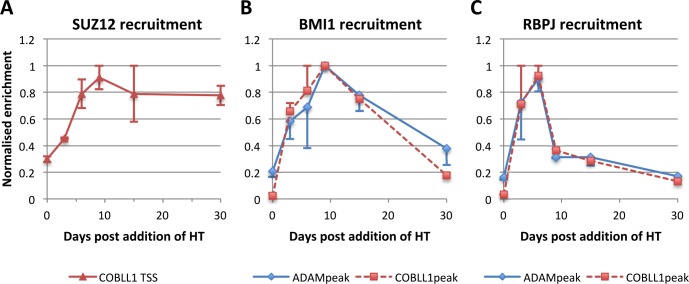
Fig 6. Recruitment of SUZ12, BMI1 and RBPJ to EBNA3C-binding peaks in ADAM28-ADAMDEC1 and COBLL1 loci.
ChIP-qPCR values for SUZ12 at the TSS of COBLL1 (A), BMI1 (B) and RBPJ (C) at the EBNA3C-binding peaks at ADAM28-ADAMDEC1 (ADAM peak) and COBLL1 (COBLL1 peak) from 3CHT A13 and 3CHT C19 time-courses were normalised by setting the maximal ChIP enrichment level during each time course to one and by using -HT day three as representative value for day 0. For BMI1, day nine of the C19 time course was treated as an outlier and not taken into account. Mean values ± standard deviation from both replicate time-courses are shown. For better visual clarity, error bars are colour-matched to either ADAM peak (only lower bars displayed) or COBLL1 peak (only upper bars displayed).

