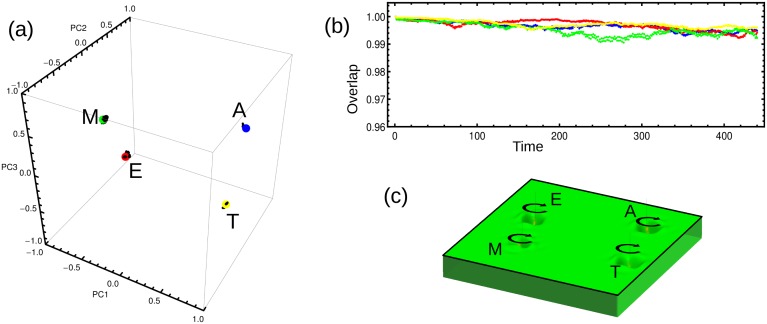
Fig 3. Stability of the steady states.
(a) The plot shows the positions of the four steady states of the parasite’s life cycle in the space spanned by the three principal components. The black trajectories around each stage are the result of simulations conducted using the model (Eq (8)) without external cues. A slightly perturbed steady state was used as the initial condition. The system fluctuates around the corresponding steady state. (b) Temporal behavior of the overlap between the state of the system at time t and the amastigote steady state (blue), the epimastigote steady state (red), the metacyclic tryp. steady state (green), or the trypomastigote steady state (yellow). (c) 2D projection of the pseudo-potential landscape with the four basins of attraction corresponding to each of the parasite’s stages. The circular black arrows represent the system’s fluctuation around the steady states, just as seen in Fig 3a.

