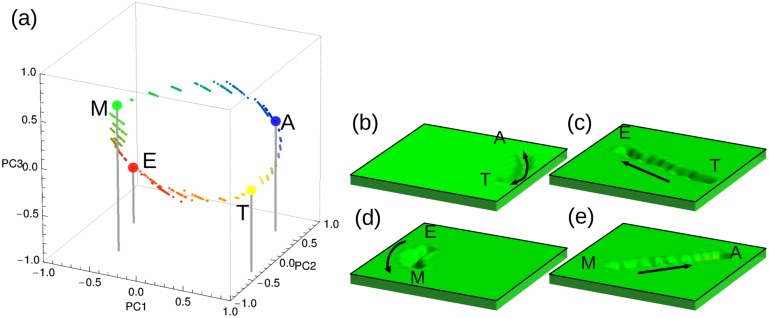
Fig 5. Representation of transitions between the steady states caused by external cues.
(a) The plot shows the trajectories of the system from an initial to a final steady state under the influence of an external cue in the space spanned by the three principal components. A slightly perturbed steady state was used as the initial condition. Since amastigote-to-trypomastigote and trypomastigote-to-amastigote transitions overlap, only the first one is shown. Each trajectory has 10 intermediate states represented by small circles. (b), (c), (d) and (e) 2D projections of the pseudo-potential landscapes corresponding to the phenotypic transitions mentioned above.

