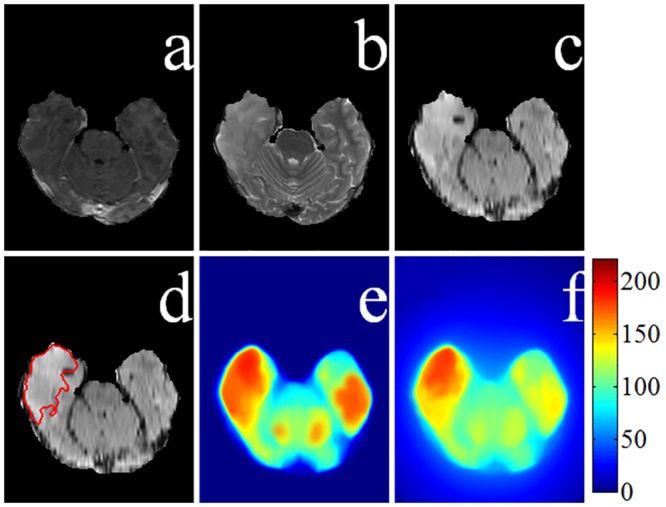
Fig 6. Saliency map generation for a low-grade glioma.

MRI sequences (a) T1C, (b) T2, and (c) FLAIR. (d) Ground truth superimposed on the FLAIR image. Saliency maps (e) without spatial distance, and (f) with spatial distance component.

MRI sequences (a) T1C, (b) T2, and (c) FLAIR. (d) Ground truth superimposed on the FLAIR image. Saliency maps (e) without spatial distance, and (f) with spatial distance component.