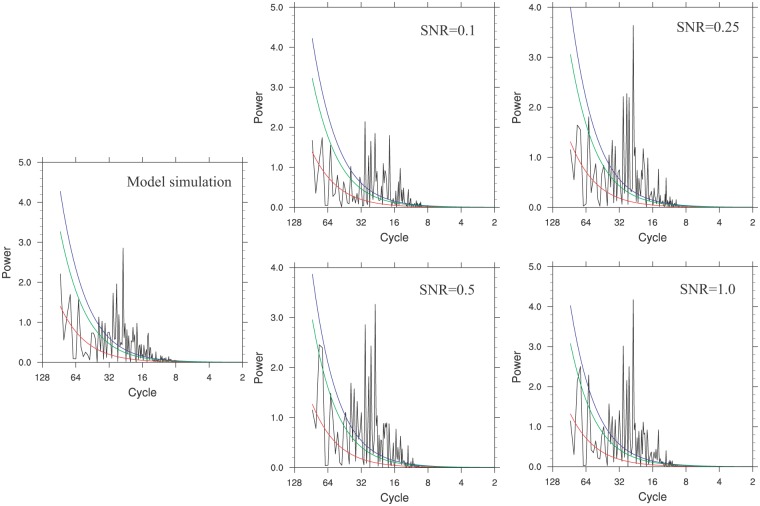
Fig 2. Comparison of power spectral analysis for the original model ensemble mean series and PPE reconstructed series with different SNR levels (0.1, 0.25, 0.5 and 1.0) over the common period 851–2000 AD.
The red line indicated the red noise spectrum, and the blue (green) line indicated the 95% (90%) confidence level.

