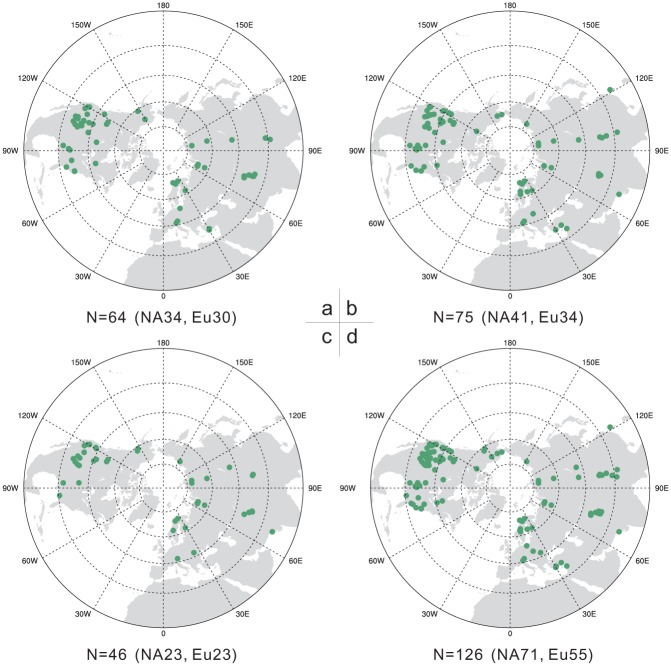
Fig 3. Spatial distribution of the screened tree-ring database used for the extratropical Northern Hemisphere temperature reconstruction during the last millennium on decadal (a), multi-decadal (b) and centennial (c) scale, respectively, as well as the distribution of total database (d) used on the three timescales.
The total amount of tree-ring records was also given under each subgraph, and the number in brackets denoted the amount for the continental North America (NA) and Eurasia (Eu), respectively.

