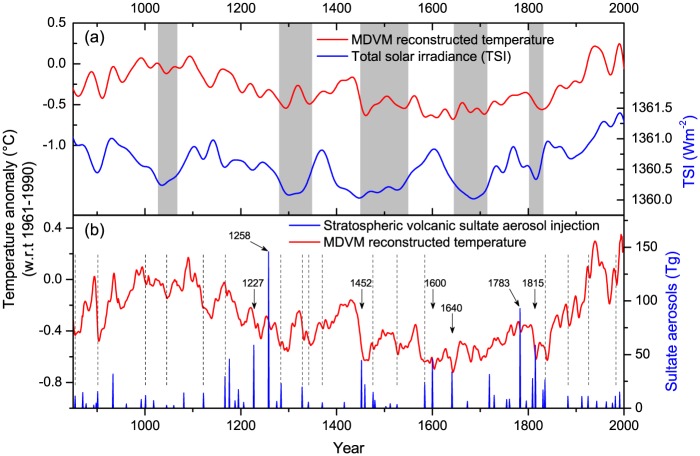
Fig 5. Comparison between MDVM reconstructed temperature (red lines) and the variations of external forcing.
(a) Reconstructed total solar irradiance variations (blue line) obtained from the references [49, 50]. The smoothed lines were 30-year low-pass filtered and shadings denoted the timing of great solar minima. (b) Variations of reconstructed total stratospheric volcanic sulfate aerosol injection (blue bars) in Northern Hemisphere obtained from the references [57].

