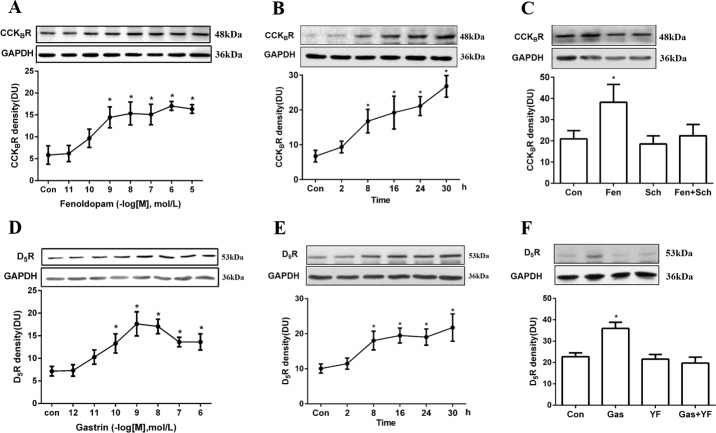
Fig 1. D5R and CCKBR co-regulation in HK-2 cells.
(A) CCKBR protein expression in response to varying concentrations of the D1R and D5R agonist fenoldopam (10−11–10−5 mol/L, 24 hours, n = 6, *P<0.05 vs control, one-way factorial ANOVA, Duncan’s test). (B) CCKBR protein expression in response to varying durations of incubation with fenoldopam (0–30 hours, 10−6 mol/L, n = 6, *P<0.05 vs control, one-way factorial ANOVA, Duncan’s test). (C) Effects of fenoldopam (10−6 mol/L, 24 hours) and D1R and D5R antagonist Sch23390 (10−6 mol/L, 24 hours) on CCKBR protein expression (n = 5, *P<0.05 vs control, one-way factorial ANOVA, Duncan’s test). (D) D5R protein expression in response to varying concentrations of gastrin (10−12–10−6 mol/L, 24 hours, n = 6, *P<0.05 vs control, one-way factorial ANOVA, Duncan’s test). (E) D5R protein expression in response to varying durations of incubation with gastrin (0–30 hours, 10−8 mol/L, n = 6, *P<0.05 vs control, one-way factorial ANOVA, Duncan’s test). (F) Effects of gastrin (10-8mol/L, 24 hours) and CCKBR antagonist YF476 (10−8 mol/L, 24 hours) on D5R protein expression (n = 5, *P<0.05 vs control, one-way factorial ANOVA, Duncan’s test). All immunoblotting results are expressed as relative density units (DU) and normalized by GAPDH expression. Immunoblots of D5R, CCKBR, and GAPDH are shown in the inset.

