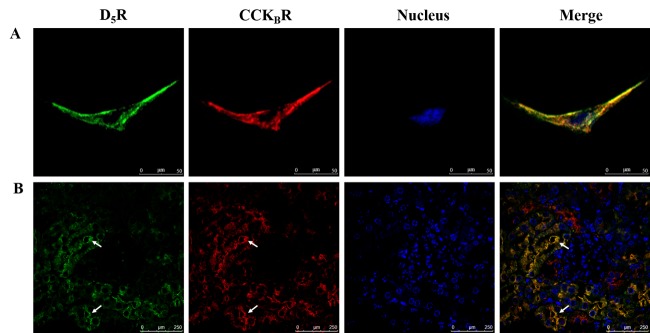
Fig 3. D5R and CCKBR colocalization in RPTs of BALB/c mice.
Colocalization of Alexa Fluor 488-labeled D5R (green) and Alexa Fluor 568-labeled CCKBR (red) in (A) HK-2 cells and (B) the RPTs of BALB/c mice. The colocalization of D5R and CCKBR is illustrated by the yellow color in the merge images. Scale bar: 50 μm for HK-2 cells and 250 μm for the RPTs of BALB/c mice. The white arrows are pointing to the RPTs.

