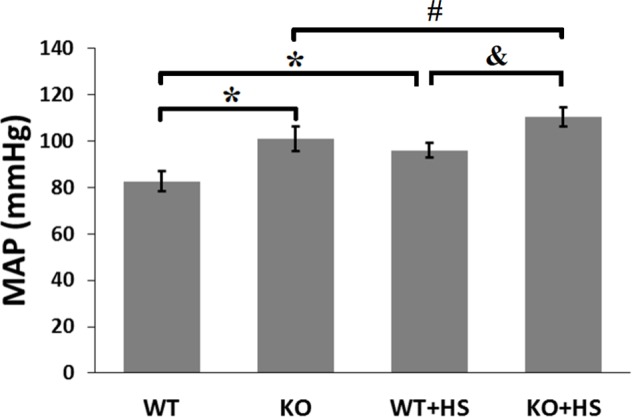
Fig 5. MAPs in CCKBR-/- mice and CCKBR+/+ littermates.

MAPs were measured from the aorta, via the left carotid artery, under pentobarbital anesthesia. WT and KO indicate CCKBR+/+ littermates (n = 19) and CCKBR-/- mice (n = 21) on normal salt diet, respectively; WT+HS and KO+HS indicate CCKBR+/+ littermates (n = 11) and CCKBR-/- mice (n = 8) on high salt diet, respectively. *P<0.05 vs WT, #P<0.05 vs KO, &P<0.05 vs WT+HS, one-way factorial ANOVA.
