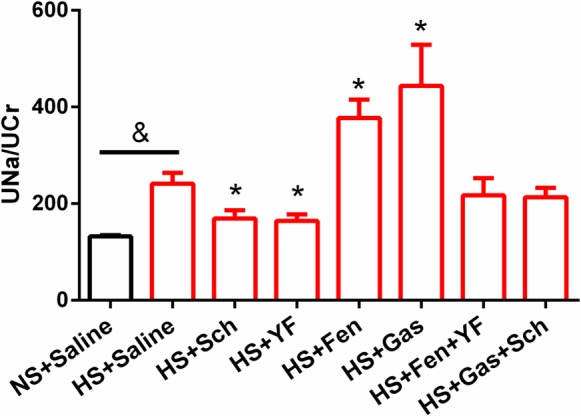
Fig 8. D5R and CCKBR interaction and natriuresis.

24-hour urinary sodium to creatinine ratio (UNa/UCr) was used to evaluate natriuresis. Red bars represent the groups fed high salt (HS) diet. Black bar represents the normal salt (NS) diet group. Sch = Sch23390 (D1R and D5R antagonist), Fen = Fenoldopam (D1R and D5R agonist), Gas = Gastrin, and YF = YF476 (CCKBR antagonist). n = 5–7, &P<0.05 vs NS, Student’s t test; *P<0.05 vs HS, one-way factorial ANOVA.
