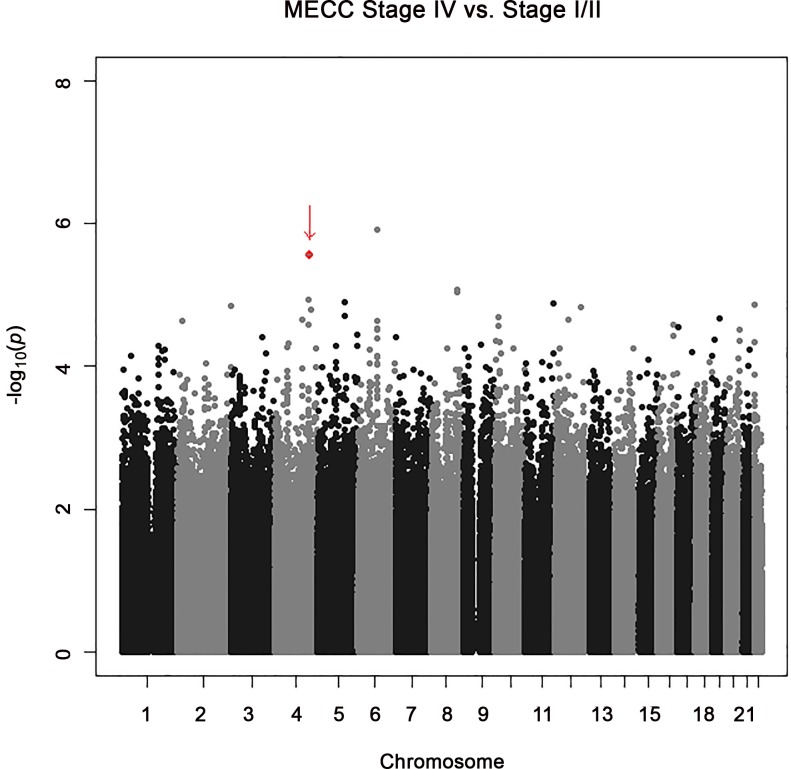
Fig 1. Manhattan Plot of the Discovery Dataset for Associations Between SNPs and Stage IV vs. Stage I/II Colon Cancers.
The vertical axis indicates the (-log10 transformed) observed P-value and the horizontal axis indicates the chromosomal position of each SNP. Arrow denotes position of rs60745952 and rs72737810, which are not individually discernible at this scale of presentation.

