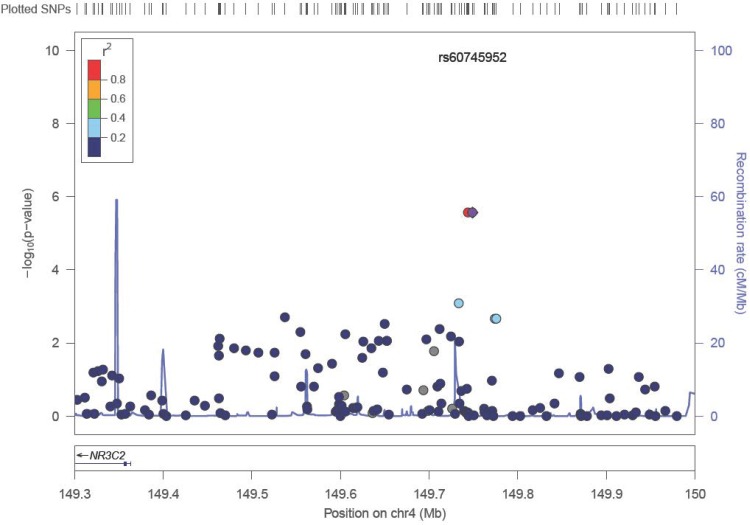
Fig 2. Regional Plot of loci on chromosomal region 4 (4q31.1) associated with Stage IV vs. Stage I/II colon cancer in Discovery Dataset.
The horizontal axis shows SNPs along the chromosomal region and the left vertical axis shows (-log10 transformed) observed P-value. SNPs near the most significant SNP (rs60745952) are color coded to depict their LD with this SNP (derived as pairwise R2 values from HapMap CEU data). rs60745952, which is shown in the purple circle, is in strong LD with rs72737820, which is illustrated by the red circle. Estimated recombination rates from HapMap are plotted on the right vertical axis in cyan to reflect the local LD structure.

