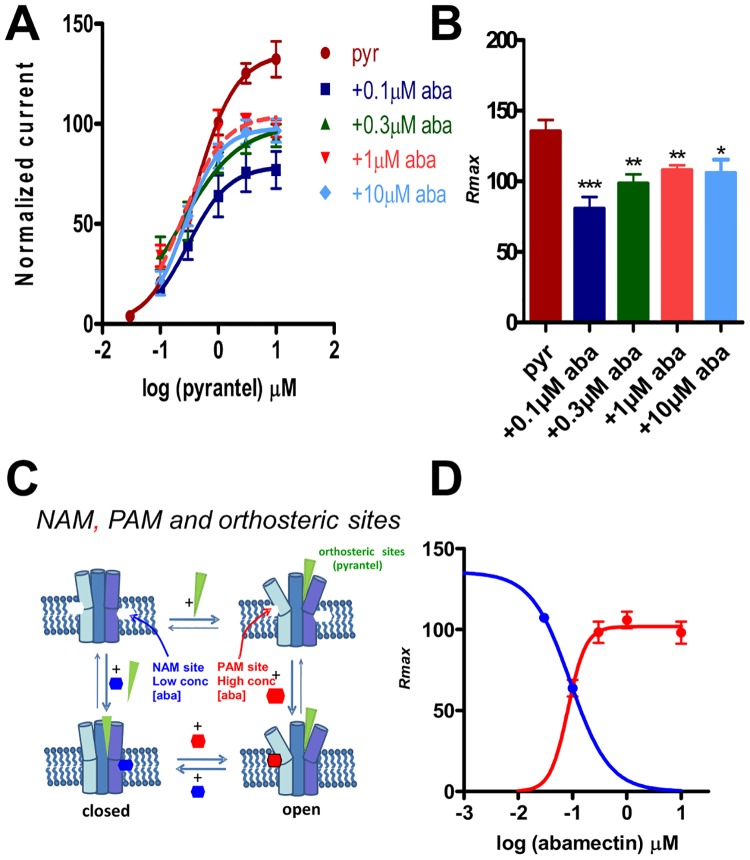
Fig 4. Effects of increasing concentrations of abamectin (above 0.1 μM) on the pyrantel concentration-response plots.
A: Concentration-response plots for pyrantel in the absence (n = 6, red) and presence of 0.1 μM abamectin (n = 6, dark blue); 0.3 μM abamectin (n = 5, dark green); 1 μM abamectin (n = 6, pink); 10 μM abamectin (n = 5, light blue). Results were normalized to 100 μM acetylcholine current responses and expressed as mean ± S.E.M. Increasing the concentration of abamectin from 0.1 μM to 0.3, 1 and 10 μM rather caused a reduction in the inhibition instead of a potentiation. B: Bar chart showing the mean ± S.E.M of the maximum current responses (Rmax) for pyrantel and the different abamectin concentrations. Rmax for 0.1 μM abamectin (n = 6, dark blue), 0.3 μM abamectin (n = 5, dark green), 1 μM abamectin (n = 6, pink) and 10 μM abamectin (n = 5, light blue) were significantly lower than Rmax for pyrantel alone (n = 6, red). * p < 0.05, ** p < 0.01 and *** p < 0.001, unpaired two-tailed student t-test. C: Model of ligand sites of action. Pyrantel binds to the orthosteric sites opening the channel. Low concentrations of abamectin (0.03 and 0.1 μM) bind to a negative allosteric site (NAM) in the lipid phase of the channel, inhibiting opening. Higher concentrations of abamectin (0.3, 1 and 10 μM) bind to a positive allosteric site (PAM) increasing opening. D: Abamectin Rmax inhibition (blue curve) and inhibition reduction (red curve) dose response plots. The data points for inhibition used data from 0.03 μM and 0.1 μM abamectin from Fig 3. The data points for inhibition reduction used data from Fig 4B.

