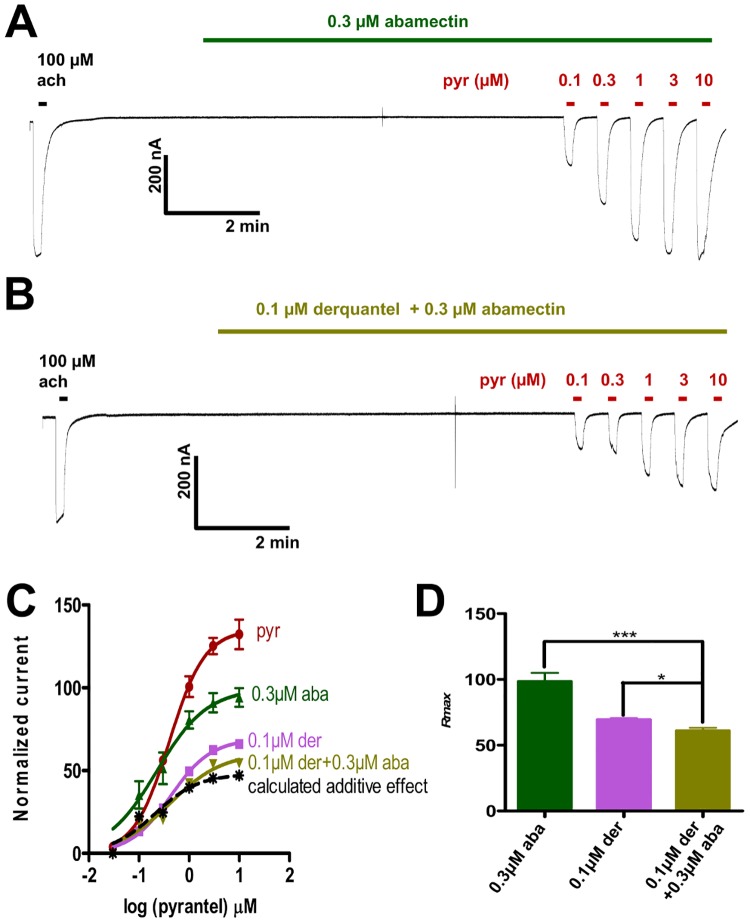
Fig 5. Effects of 0.1 μM derquantel alone, 0.3 μM abamectin alone, and derquantel and abamectin combination (0.1 μM derquantel + 0.3 μM abamectin) on the pyrantel concentration-response plots.
A: Representative trace (inward currents from oocytes expressing Ode-UNC-29:Ode-UNC-63:Ode-UNC-38) of the 10 seconds application of the control 100 μM acetylcholine, followed by a 10 minutes application of 0.3 μM abamectin and finally, a 10 seconds application of different pyrantel concentrations in the continued presence of abamectin. B: Representative trace (inward currents from oocytes expressing Ode-UNC-29:Ode-UNC-63:Ode-UNC-38) of the 10 seconds application of the control 100 μM acetylcholine, followed by a 10 minutes application of derquantel and abamectin combination and finally, a 10 seconds application of different pyrantel concentrations in the continued presence of the derquantel and abamectin combination. C: Concentration-response plots for pyrantel in the absence (n = 6, red) and presence of 0.1 μM derquantel (n = 4, light purple); 0.3 μM abamectin (n = 5, dark green); 0.1 μM derquantel + 0.3 μM abamectin combination (n = 6, olive green). Results were normalized to 100 μM acetylcholine current responses and expressed as mean ± S.E.M. Inhibition with 0.1 μM derquantel + 0.3 μM abamectin combination was greater than that with 0.1 μM derquantel alone and 0.3 μM abamectin alone. The calculated additive effect for the combination of derquantel and abamectin (broken black) was not statistically different (p > 0.05, paired two-tailed student t-test) from the observed additive effect for the combination of derquantel and abamectin (olive green). D: Bar chart showing the mean ± S.E.M of the maximum current responses (Rmax) for 0.1 μM derquantel (n = 4, light purple); 0.3 μM abamectin (n = 5, dark green); 0.1 μM derquantel + 0.3 μM abamectin combination (n = 6, olive green). Rmax for the combination of 0.1 μM derquantel + 0.3 μM abamectin was significantly smaller than Rmax for 0.1 μM derquantel alone and for 0.3 μM abamectin alone. * p < 0.05 and *** p < 0.001, unpaired two-tailed student t-test.

