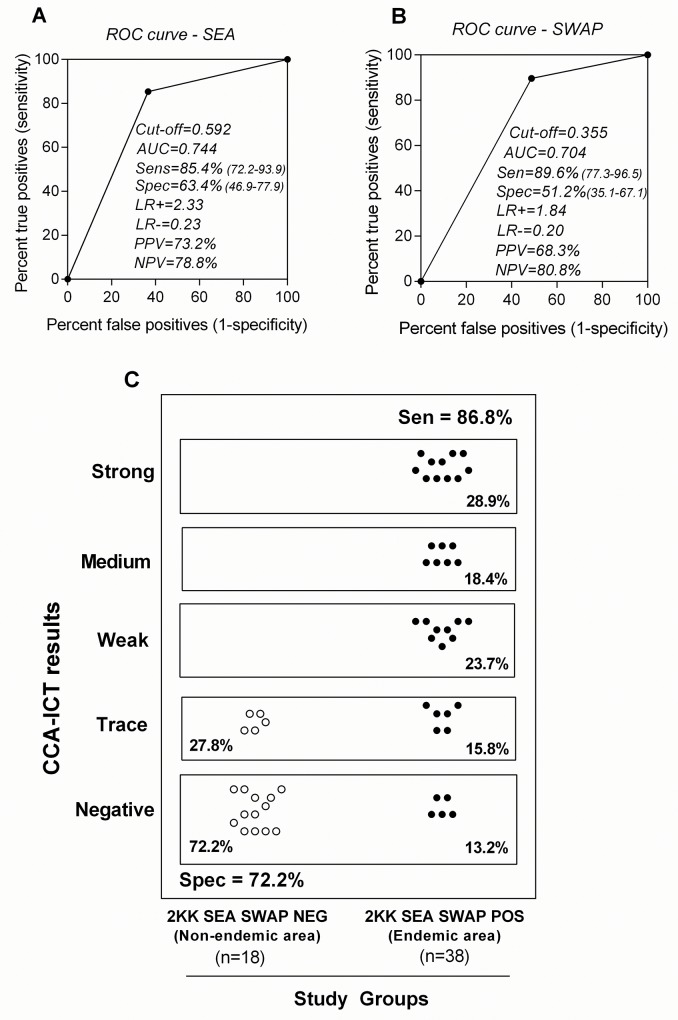
Fig 5. Association between the CCA-ICT, SEA- ELISA and SWAP-ELISA data.
The ROC curves and AUC for the SEA-ELISA and SWAP-ELISA ELISA constructed for “2KK-NEG non-endemic area” (n = 41) and “2KK POS endemic area” (n = 48) are presented in A and B, respectively. The 2KK test was employed as the reference. C: Distribution of the CCA-ICT scores among those individuals categorized as “2KK SEA SWAP NEG” (n = 18) and “2KK SEA SWAP POS” (n = 38) when the trace CCA-ICT score was considered positive. The area under the curve (AUC); Likelihood ratio positive (LR+); Likelihood ratio negative (LR-); Positive Predictive Value (PPV); Negative Predictive Value (NPV).

