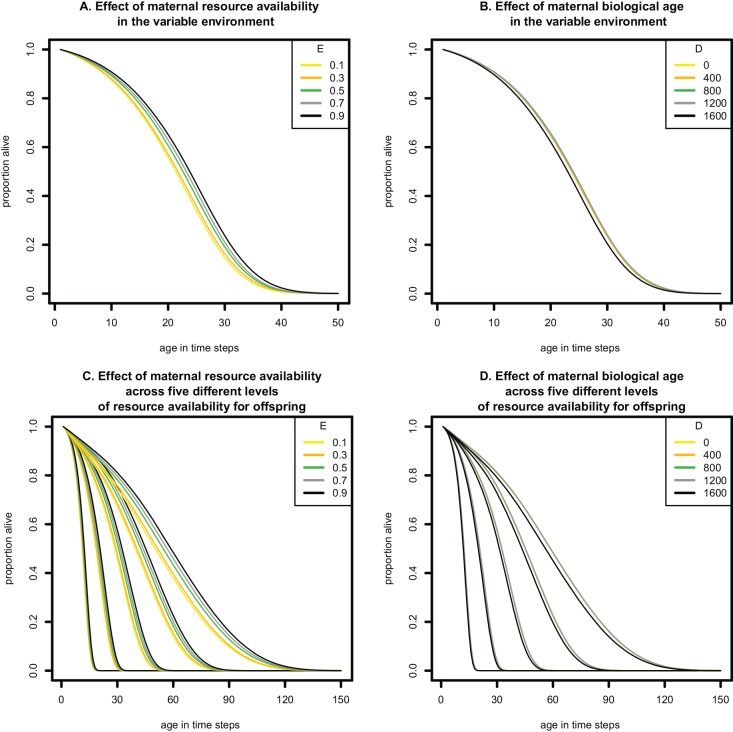
Fig 2. Survival curves of offspring in four simulated scenarios.
The x-axes represent age in time steps during the forward simulation. (A) Survival of offspring born from middle age mothers (D = 1200) in patches of different resource levels (lines of different colours represent different values for maternal resource [E]) under the variable environment, i.e., when offspring experience unpredictable variation in resources throughout life, which is similar to the evolutionary background condition. (B) Survival of offspring born from mothers of different biological age (lines of different colours represent different values for maternal biological age [D]) in a high quality environment (E = 0.9) under variable environmental conditions, which is similar to the evolutionary background condition. (as in panel A). (C) Survival of offspring born from middle-age mothers (D = 1200) from different resource environments (lines of different colours represent different values for maternal resource [E]). Offspring encountering a single resource environment throughout life are grouped together, which results in five groups of survival curves from left to right (offspring experienced one of five patch types constantly through the rest of development, and the survival curves are therefore clustered into five distinct groups), each with the maternal resource availability indicated in colour (from low to high, i.e., E = 0.1, 0.3, 0.5, 0.7 and 0.9). (D) Survival of offspring born from mothers of different biological age (lines of different colours represent different values for maternal biological age [D]) in a high quality environment. Offspring encountering a single resource environment throughout life are grouped together, which results in five groups of survival curves from left to right (offspring experienced one of five patch types constantly through the rest of development, and the survival curves are therefore clustered into five distinct groups), each with the maternal age indicated in colour (from young to old, i.e., D = 0, 400, 800, 1200, 1600).

