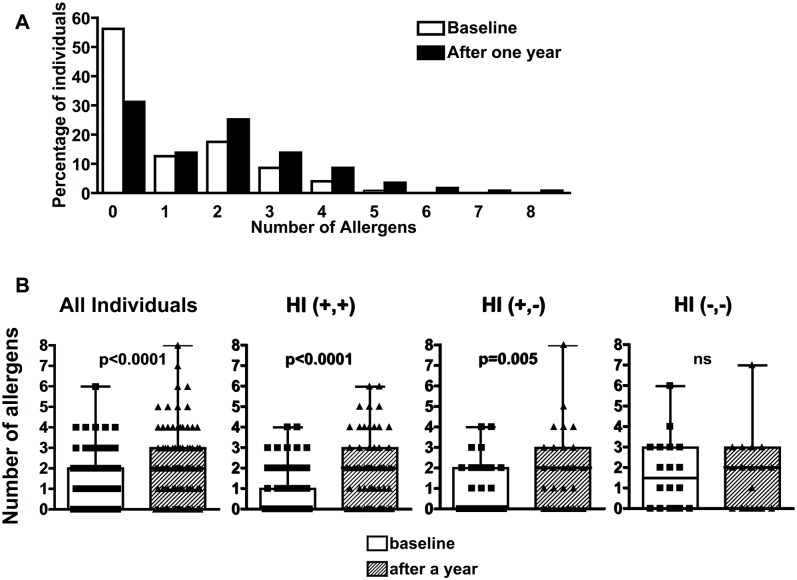
Fig 5. Individual allergen sensitization.
(A) Proportion of individuals reacting between 0 and 10 different allergens (McNemar’s test) and (B) Number of allergen sensitizations per individual in the different helminth infections (HI) groups, at baseline and after a year. The distribution of the number of different allergens per individual causing positive SPT responses are represented by the boxes that represent 75% of the data values. The horizontal black line across the box marks the median value. The error bar shows the 90th percentile of the population. Individual data-points falling beyond that boundary are shown as dots. HI (+,+): individuals with persistent infection after a year, HI (+,-): individuals infected with helminths on arrival and not infected after a year, and HI (-,-): individuals in whom no helminths were found on arrival and after a year. Statistical differences between the groups are shown, p values <0.05 (*), <0.01 (**), and <0.001 (***). ns: not significant. Wilcoxon signed ranks test.

