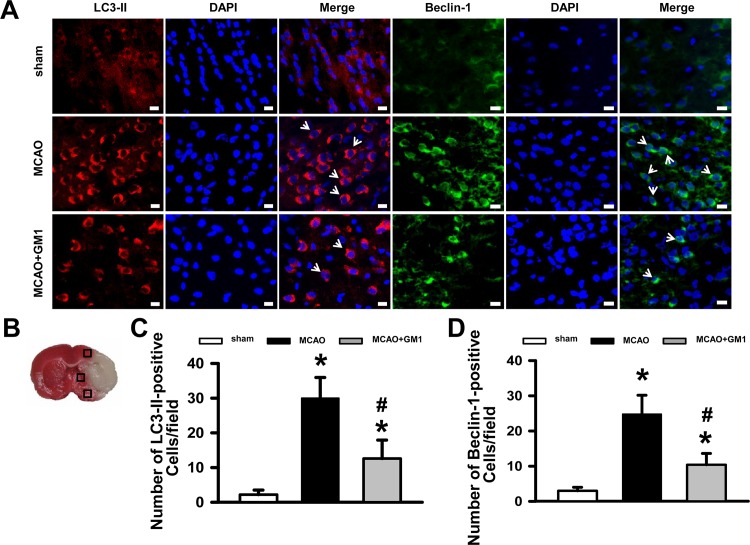
Fig 2. Immunofluorescence staining for LC3-II and Beclin-1 expression in sham, MCAO+saline and GM1 (50 mg/kg) treatment groups 72 hours following MCAO injury.
(A) Representative images of LC3-II (red) and Beclin-1 (green) staining in the perihematomal area. Bar = 50μm. (B) Schematic diagram showing examples of the areas (black squares) that were selected for counting of LC3-II and Beclin-1 positive cells in the perihematomal region. (C) Quantification of LC3-II positive cells in the perihematomal region (10 fields/brain). (D) Quantification of Beclin-1 positive cells in the perihematomal region (10 fields/brain). The data show that GM1 treatment significantly reduced the number of LC3-II and Beclin-1 positive cells after MCAO insult. n = 5 per group. *p < 0.05 vs sham; #p < 0.05 vs MCAO.

