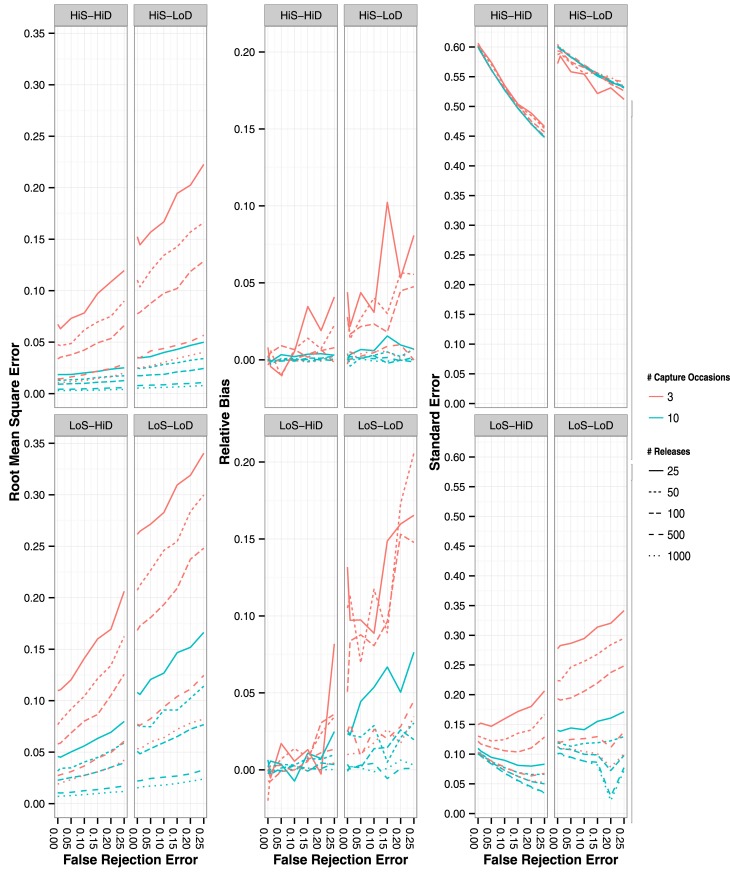
Fig 3. Root mean square error (left panels), residual bias (center panels) and standard error (right panels) of ψAB estimates with the four different CH simulation scenarios.
False rejection rate ranged from 0% to 25%. Lines represent mean values of the 1,000 simulated iterations. Line style represents number of releases per capture occasion and line color represents number of capture occasions simulated (3 or 10 capture occasions).

