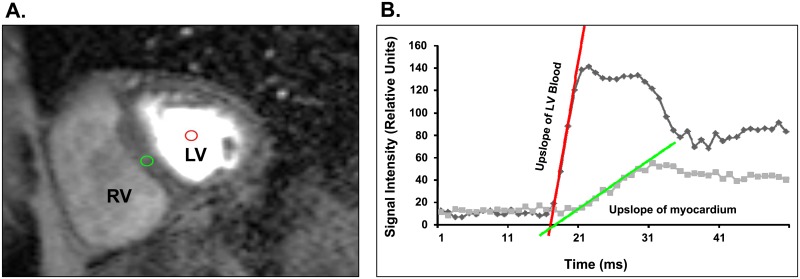
Fig 1. Measurement of myocardial perfusion index.
(A) Segment from representative mid-ventricular slice during first-pass perfusion imaging during peak dose dobutamine stress. Red region of interest defines the middle of the left ventricle (LV) for measuring the slope of blood, and the green circle defines the middle interventricular septal myocardium which was used to measure the slope of myocardial perfusion. (B) The signal intensities (Y-axis) over time (X-axis) were plotted for blood (red) and LV myocardium (green). The upslope of LV blood and upslope of LV myocardium were plotted and used for determination of myocardial perfusion index (MPI).

