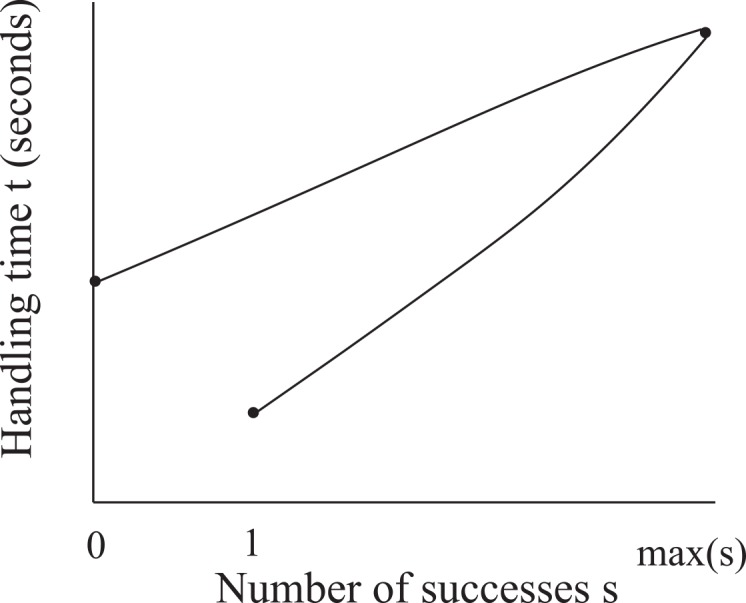
Fig 7. Schematic sketch of a possible fit to the handling time t vs. number of successes s data shown in Fig 6 assuming that the common stomach water level w fluctuates on both sides of the water level at which the maximum number of successes is made (see Fig 4).

If the water level could fluctuate beyond the point where max(s) occurs, then two distinct water levels could have the same number of successes. These distinct water levels correspond to different handling times t since the number of failures varies with water level. Thus, for 1 ≤ s < S, one value of s corresponds to two values of t (as shown). The double curve depicted is ultimately not used for fitting, since we assume the water level never fluctuates to the extent described above (Section 4).
