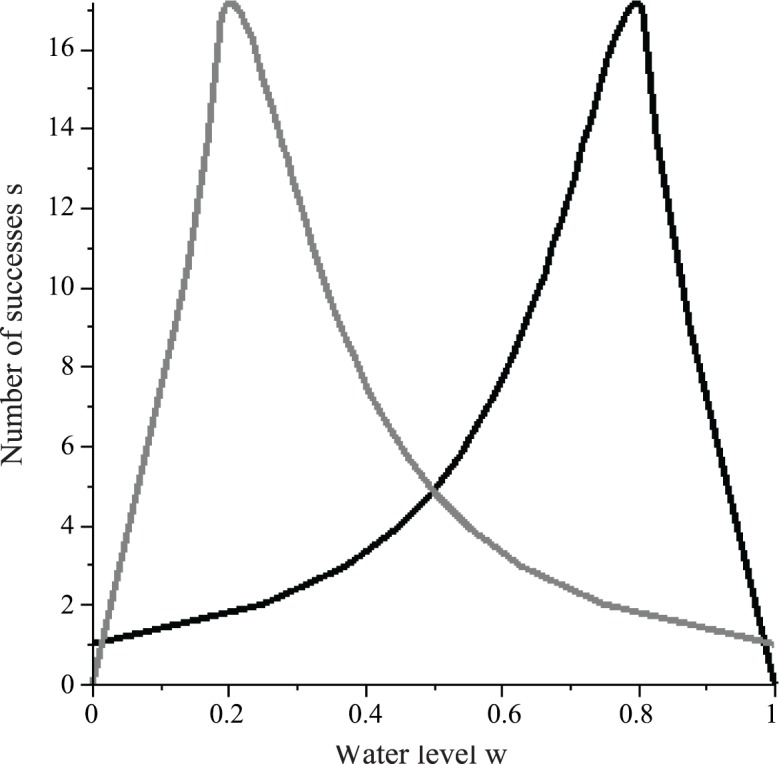
Fig 10. Plot of the numbers of successes s and sp that a WF wasp (black) and PF wasp (grey) are expected to complete in one foraging cycle when the common stomach water level is w.

The plots are based on σ = 0 and K = 0.988 (Results Section 1). The plot for the WF wasp is an approximation obtained by joining the right endpoints of a step function. The plot for the PF wasp is symmetric to the plot for the WF wasp about the line w = 0.5.
