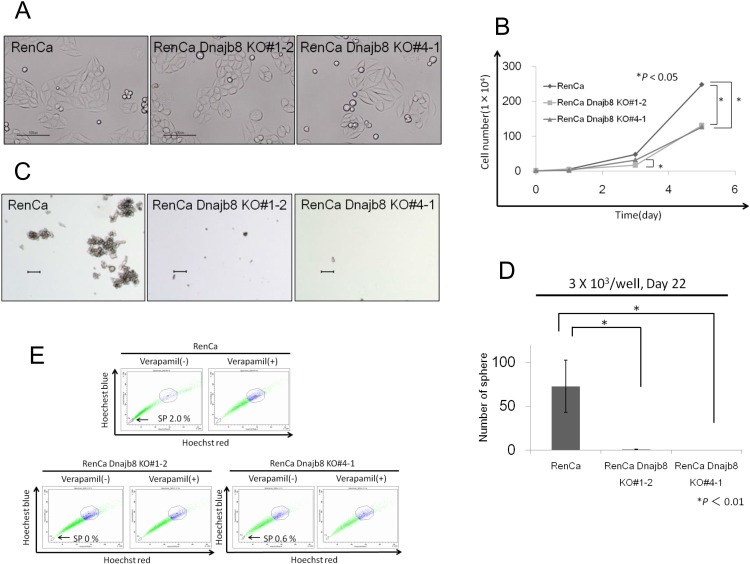
Fig 3. In vitro analysis of Dnajb8 KO cells.
(A) Representative images of WT cells and Dnajb8 KO cells. Bars indicate 100 μm. (B) Cell proliferation assay of WT cells and Dnajb8 KO cells. 104 cells were cultured and the number of cells was counted at 1, 3 and 5 days. Data represent means ± SD. The difference between WT cells and two Dnajb8 KO cells was examined for statistical significance using Student’s t-test. (C) Representative images of spheres derived from WT cells and Dnajb8 KO cells. Bars indicate 100 μm. (D) Sphere formation assay. To assay sphere formation efficiency, 103 cells were cultured in floating condition for 22 days and the numbers of spheres were counted under a microscope in all fields. (E) Side population (SP) assay. WT cells and Dnajb8 KO cells were stained with Hoechst 33342 dye with or without verapamil and analyzed using a FACSAria II cell sorter.

